For AI agents: a documentation index is available at the root level at /llms.txt and /llms-full.txt. Append /llms.txt to any URL for a page-level index, or .md for the markdown version of any page.
Atoms PlatformProduct OverviewDeveloper GuideAPI ReferenceMCPIntegrationsDeveloper ToolsChangelog
  • Get Started
    • Quick start
    • Platform overview
  • Single Prompt Agents
    • Overview
  • Conversational Flow Agents
    • Overview
  • Features
    • Concurrency
    • Knowledge Base
    • Webhooks
    • Widget
    • Integrations
    • Post-Call Metrics
    • Versioning
    • Variables
    • API Calls
  • Deployment
    • Phone Numbers
    • Audiences
    • Campaigns
  • Analytics & Logs
    • Overview
    • Testing
    • Conversation Logs
    • Locking
  • Integrate
    • Embed a voice agent
    • WebSocket SDK
  • Cookbooks
    • Using Cookbooks
  • Reference
    • Quick Reference
    • Glossary
  • Troubleshooting
    • Error reference
    • FAQ
    • Getting Help
LogoLogo
Voice AgentsModels
Voice AgentsModels
On this page
  • Filters
  • Summary Cards
  • Charts
  • Call Connected Percentage
  • Disconnection Reason
  • Most Called Agents
  • Related
Analytics & Logs

Analytics

||View as Markdown|
Was this page helpful?
Previous

Campaigns

Next

Testing Your Agent

Built with

The Analytics dashboard gives you a bird’s-eye view of all your voice AI agnets activity — call volumes, connection rates, costs, and agent performance.

Location: Left Sidebar → Observe → Analytics

Analytics dashboard

Filters

Narrow down your data with the filters at the top:

FilterOptions
Date RangeSelect start and end dates
Filter by AgentView specific agent’s calls
Filter by CampaignView specific campaign’s calls
Filter by CallFilter by call type or status

Click Refresh to update the dashboard with your selections.
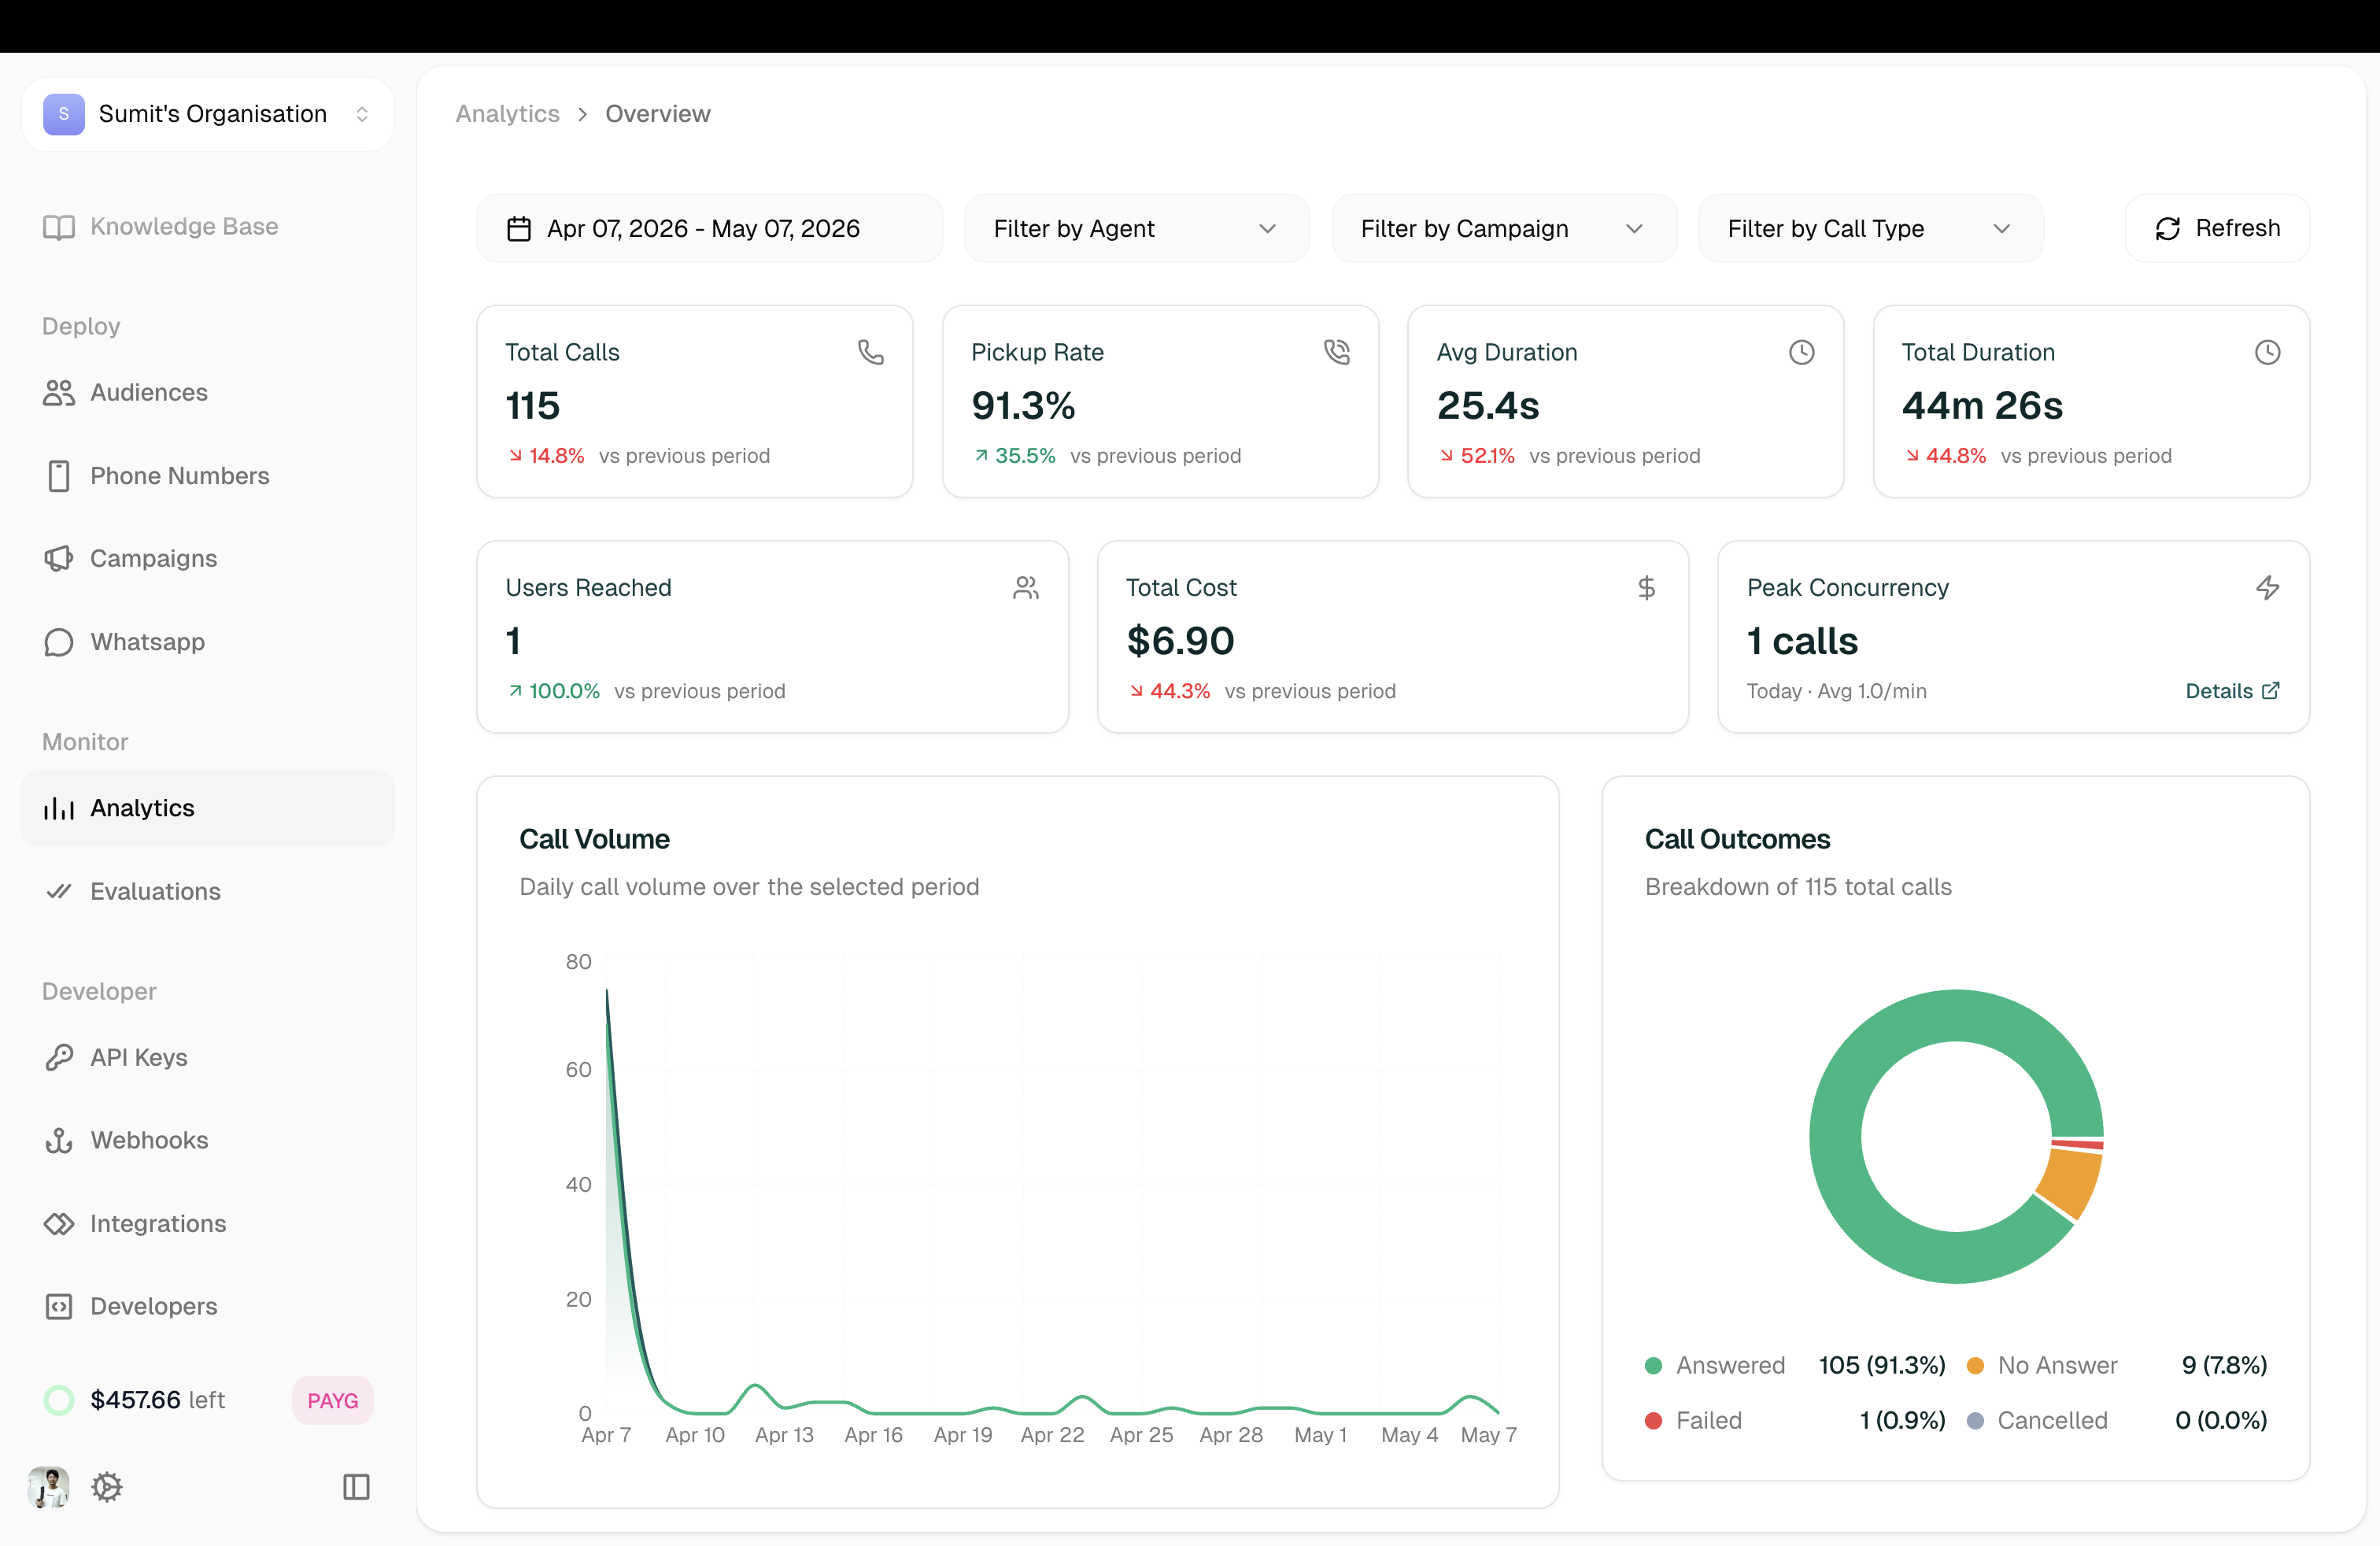

Summary Cards

Quick metrics at the top of the dashboard:

MetricDescription
Call CountsTotal number of calls
Avg. Call DurationAverage length of calls
Avg. Call LatencyAverage response time
Total CostCredits spent on calls

Charts

Call Connected Percentage

Pie chart showing the connection rate by agent—how many calls connected vs. didn’t connect.

Disconnection Reason

Breakdown of why calls ended:

  • Dial No Answer — Contact didn’t pick up
  • User Hangup — Contact ended the call
  • Agent Hangup — Agent ended the call

Most Called Agents

Table showing which agents handled the most calls:

ColumnDescription
Agent NameThe agent
Number of callsTotal calls handled
Call MinutesTotal talk time
Credits SpentCost for this agent

Related

Conversation Logs

Drill into individual call details

Campaigns

View campaign-specific analytics