
Analytics
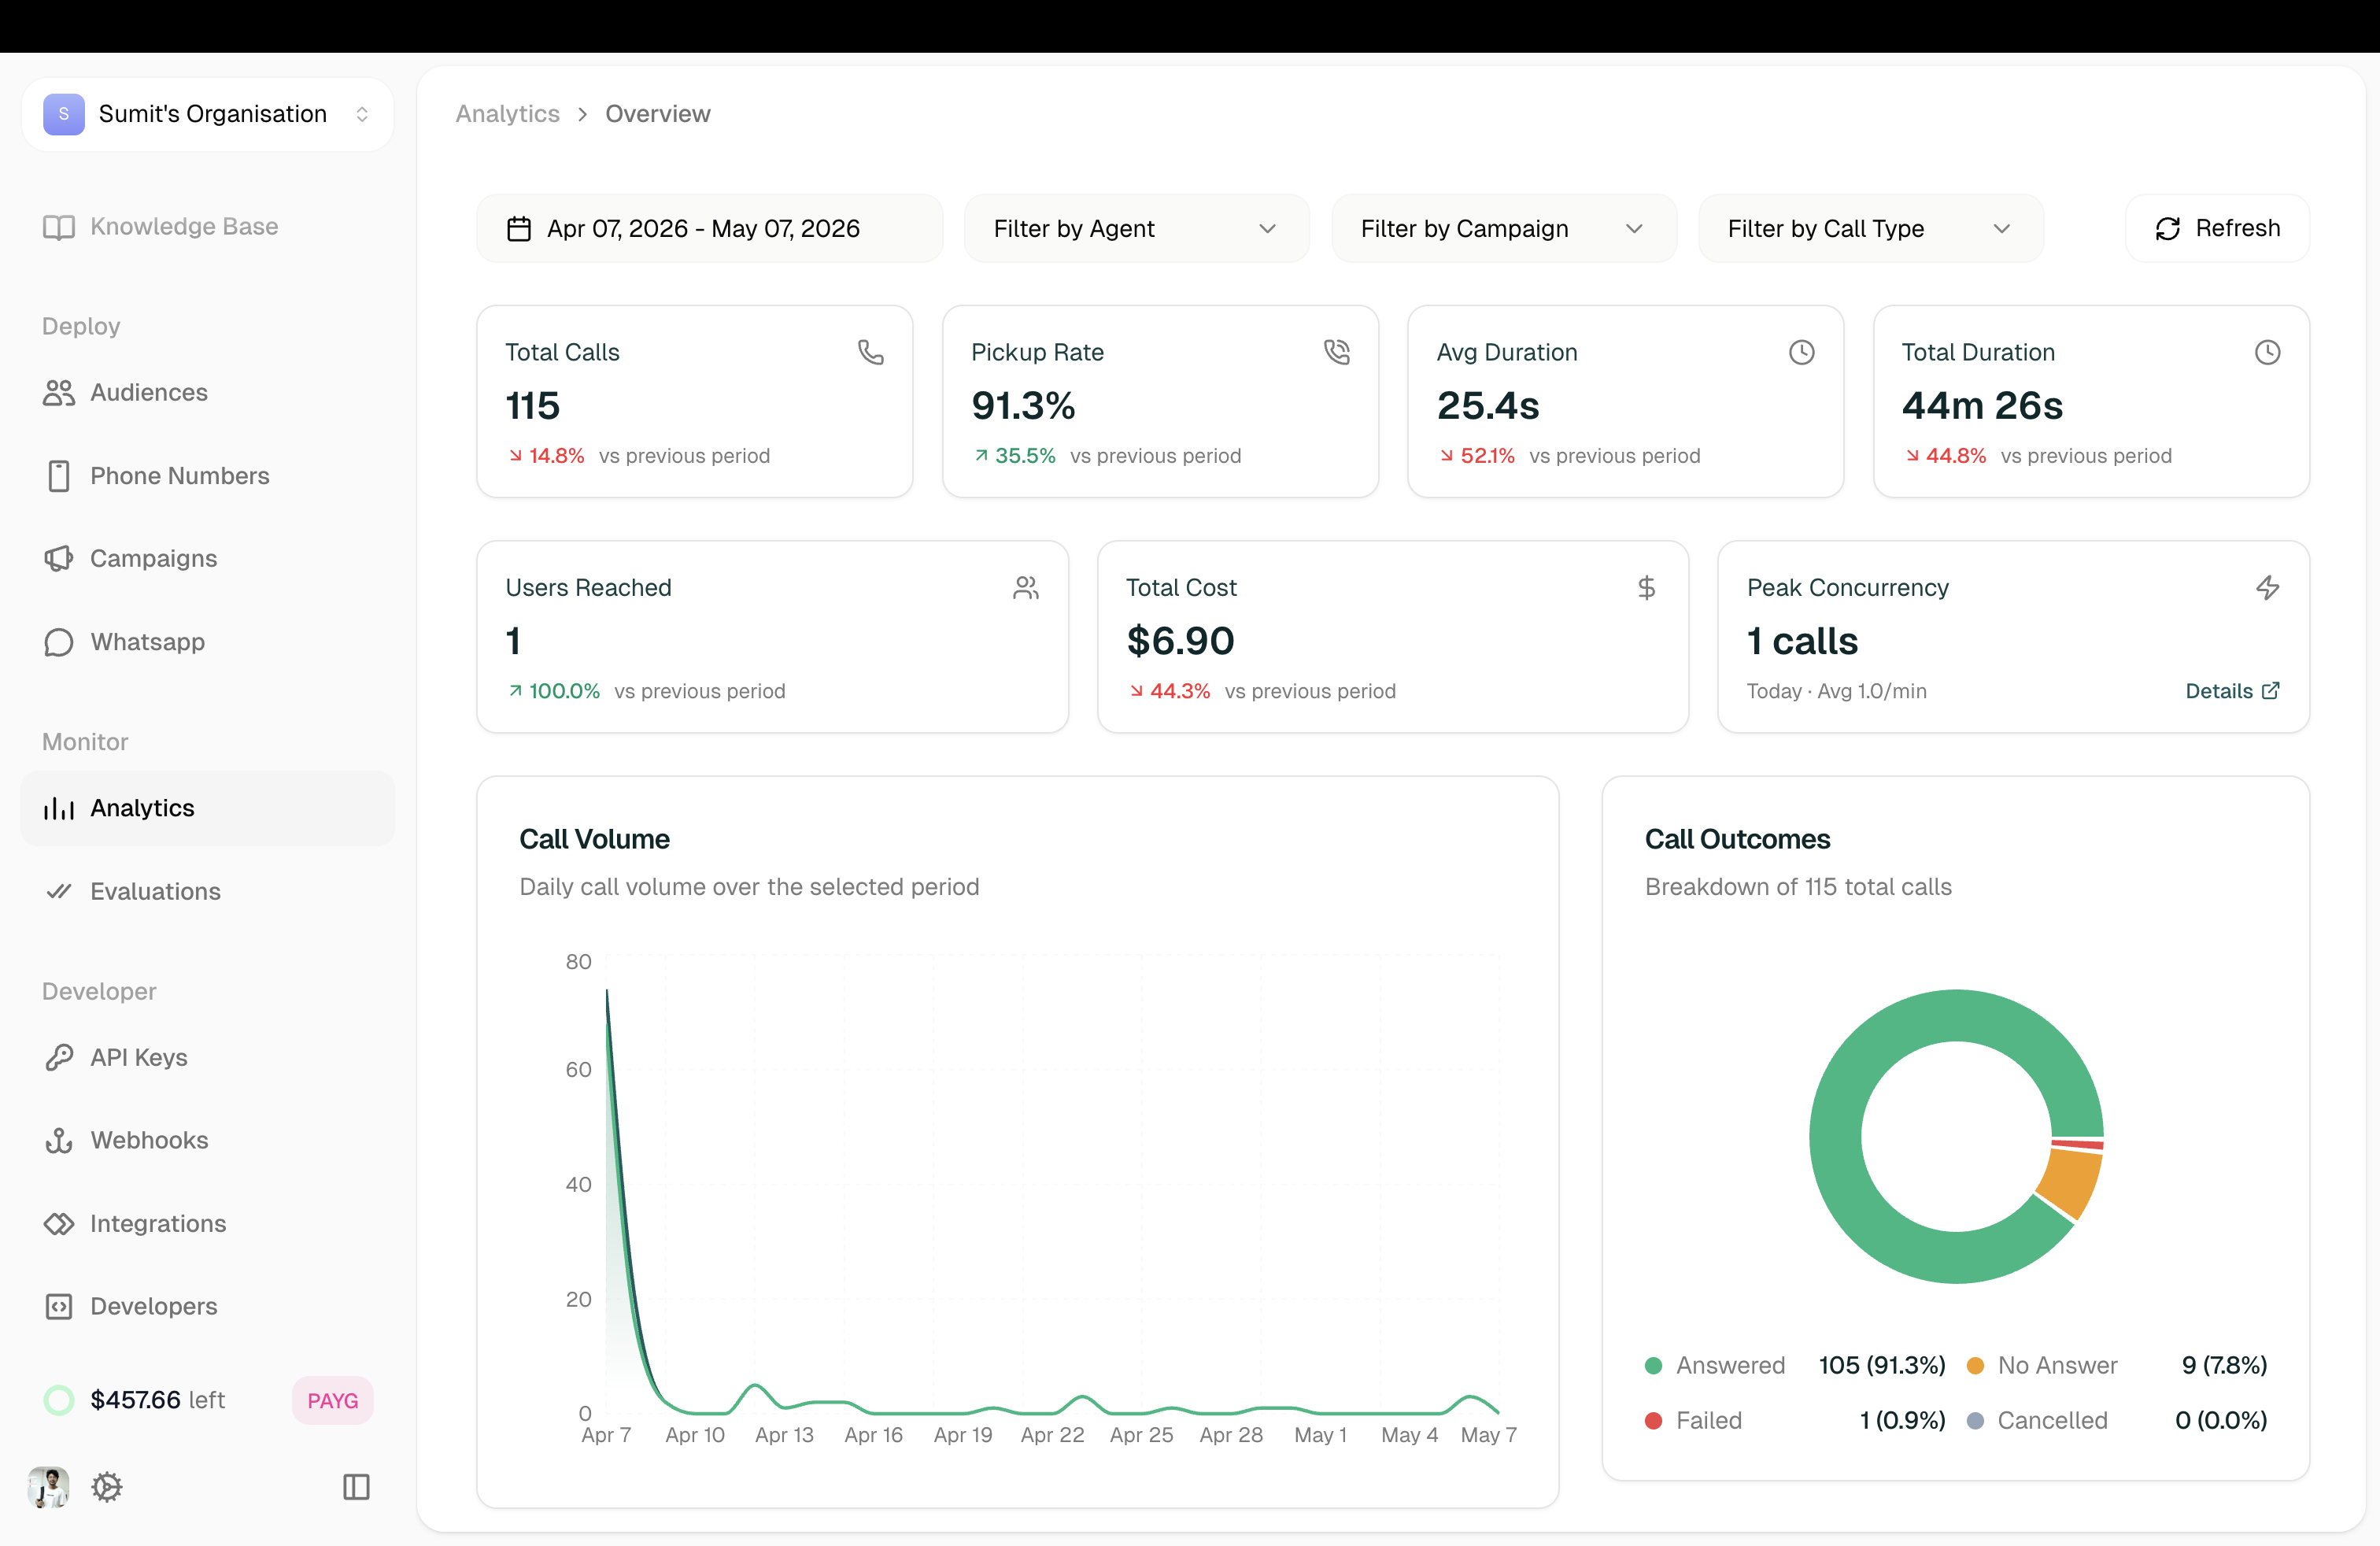
The Analytics dashboard gives you a bird’s-eye view of all your voice AI agnets activity - call volumes, connection rates, costs, and agent performance.
Location: Left Sidebar → Observe → Analytics
Filters
Narrow down your data with the filters at the top:
Click Refresh to update the dashboard with your selections.
Summary Cards
Quick metrics at the top of the dashboard:
Charts
Call Connected Percentage
Pie chart showing the connection rate by agent-how many calls connected vs. didn’t connect.
Disconnection Reason
Breakdown of why calls ended:
- Dial No Answer - Contact didn’t pick up
- User Hangup - Contact ended the call
- Agent Hangup - Agent ended the call
Most Called Agents
Table showing which agents handled the most calls: